

Why Before-After Photos Hide the Real Retail Problem

Why Before-After Photos Hide the Real Retail Problem
Before-after photos are widely used to track visual merchandising execution. They provide visible proof that issues were addressed and create a sense of control across large store networks.
However, they often create a false sense of resolution. While they show that something was fixed, they do not reveal how long the issue existed before correction or whether the fix arrived in time to influence customer behaviour.
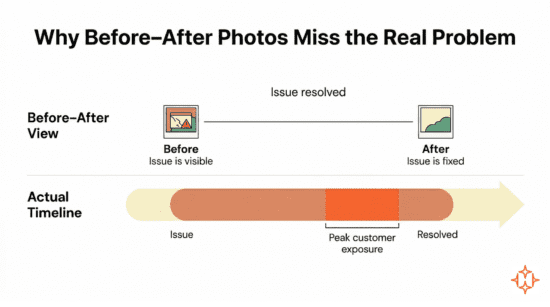
Execution impact depends on how long an issue remains visible to customers and when it occurs during the trading cycle.
For senior leaders, this creates a decision blind spot. VM execution appears under control, while issues may remain unaddressed during commercially important hours. This directly affects how execution performance is interpreted and where intervention is prioritized.
What before-after photos actually confirm
A before-after photo answers a narrow operational question: “Was the shelf eventually corrected?”
It does not answer questions that determine business impact and prioritization:
- How long was the shelf non-compliant?
- Did the issue persist through peak store hours?
- How many customers encountered the shelf in a degraded state?
- Was the correction timely enough to influence conversion?
A shelf corrected on Monday morning may be logged as resolved, even if it remained incorrect throughout the weekend when traffic and revenue potential were highest. In reporting, this appears as a completed task, even though the issue persisted during peak exposure.
Based on our experience working with numerous retail brands across sectors, VM issues often persist longer than assumed. Because corrections are eventually documented, the duration of non-compliance is not reflected in reporting. As a result, issues that last for extended periods are treated the same as those resolved quickly.
This leads to a recurring pattern:
- dashboards show improving compliance
- audits indicate closure of issues
- customer perception and conversion remain unchanged
This makes stores with delayed correction appear similar to those that recover quickly.
The system reflects task completion, not the duration of customer exposure. Without this context, improvement signals do not align with actual store conditions. Because delayed resolution is not visible, the same issues continue without escalation.
Why timing matters more than proof
VM breakdowns have the greatest impact when they overlap with periods of high customer exposure. A misaligned shelf during low-traffic hours may have limited effect, while the same issue during evenings, weekends, or campaign periods can significantly influence outcomes.
The impact of execution issues depends on how duration and timing combine. The following scenarios illustrate how this affects prioritization.
| Issue Scenario | Exposure Pattern | Likely Impact | Required Action |
| Short duration, low-traffic period | Limited visibility | Minimal impact | Standard resolution |
| Short duration, peak hours | High but brief exposure | Missed conversions in key window | Immediate escalation |
| Long duration, low traffic | Moderate cumulative exposure | Gradual performance erosion | Process correction |
| Long duration, peak overlap | Sustained high exposure | Significant revenue impact | Priority intervention and root cause fix |
| Frequent short issues | Repeated exposure cycles | Inconsistent experience | Fix execution rhythm |
| Recurring long issues | Persistent breakdown | Structural failure | Operational redesign |
The relationship between duration and timing becomes clearer when viewed structurally:
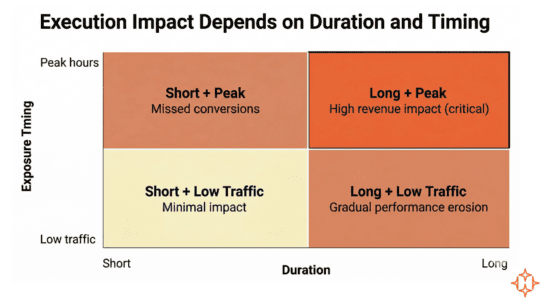
Without visibility into duration and timing, these distinctions are not captured in reporting, and all scenarios are treated similarly.
When reporting does not distinguish between early and late fixes, execution may appear improved even when the issue remained during peak hours. In such cases, the issue is resolved operationally but continues to affect outcomes.
This explains why strong VM scores can coexist with flat or declining in-store performance. Reported improvement reflects completion of tasks, not the timing of their impact.
How reporting distorts decision-making
Traditional VM reporting aggregates outcomes:
- number of completed tasks
- percentage of compliant stores
- before-after photo counts
These metrics create a binary view of execution: compliant or non-compliant.
As a result, execution is evaluated based on completion rather than speed of recovery.
They do not distinguish between short-lived issues and those that remain unresolved for extended periods.
This makes it difficult to prioritize issues based on their actual impact on customers.
Two stores may both report one VM issue and one correction, yet their commercial exposure can be vastly different:
They fail to capture persistence. Two stores may both report one VM issue and one correction, yet their commercial exposure can be vastly different:
| Store | Time shelf stayed broken | Time of correction | Business impact |
| Store A | 45 minutes | Mid-day | Minimal |
| Store B | 48 hours | Monday morning | Significant |
In most reports, both stores are treated as equally compliant, despite significant differences in duration and impact.
This leads to the same level of attention and prioritization, even though the underlying issues are not equivalent.
In practice, delayed correction during high-exposure periods carries greater commercial risk than short, quickly resolved issues.
Why this is not a store-level failure
Store teams operate within real constraints: staffing availability, customer load, replenishment cycles, and competing priorities.
The issue is not execution intent, but measurement design. When teams are evaluated only on whether something was eventually fixed, speed of recovery is deprioritized.
Teams respond to how performance is measured, not just what is expected.
Over time, organizations optimize for documentation rather than timely resolution.
As long as delayed fixes are recorded as compliant, there is no signal to correct this behavior.
How AI and continuous visibility close the gap
AI-driven photo validation and camera analytics introduce a time dimension that before-after photos lack.
This shifts execution tracking from static validation to continuous visibility.
Instead of isolated snapshots, leaders gain visibility into:
- when a deviation first appeared
- how long it persisted
- whether it recurred after correction
- how frequently similar issues surface
This allows issues to be evaluated based on duration, recurrence, and timing rather than simple completion.
Over time, execution patterns become visible. Some locations recover within hours. Others remain broken for days. Some issues recur briefly but often. Others persist infrequently but for long durations.
As a result, short but frequent issues, long-duration breakdowns, and recurring deviations can be identified and addressed differently.
What high-performing organizations do differently
High-performing organizations do not rely solely on proof that issues were resolved. They track how execution behaves over time.
They track recovery time, exposure during peak periods, and recurrence of issues across locations.
- They recognize that:
- late fixes still represent lost opportunity
- duration affects impact as much as occurrence
- faster recovery influences outcomes more than stricter enforcement
Their focus shifts from whether an issue was fixed to whether it was resolved within a timeframe that preserves customer experience.
As a result, VM reporting becomes more aligned with commercial reality.
How HipHip.AI Brings Time-Based Visibility to Execution
HipHip.AI extends execution tracking beyond static validation by introducing continuous, time-based visibility across stores. Instead of capturing isolated before-after states, it tracks how execution behaves over time and how it aligns with actual store conditions.
This enables a more complete view of execution through:
- Issue detection with timestamps
- Duration tracking
- Peak-period overlap visibility
- Recovery time measurement
- Recurrence and pattern detection
With these capabilities, execution is no longer evaluated only on completion. Issues can be assessed based on their duration, timing, and recurrence, allowing teams to prioritize actions based on actual customer exposure.
Over time, this creates a clearer understanding of where execution breaks down, how quickly stores recover, and which issues require structural intervention rather than repeated fixes.
For retailers evaluating how time-based VM visibility and execution analytics can support better decision-making, please reach us at [email protected]
Conclusion
Before-after photos confirm that execution was eventually corrected, but they do not indicate whether it was corrected in time to influence customer decisions.
When reporting focuses only on completion, it treats delayed correction and fast recovery as equivalent, even though their impact on store performance can be very different. This creates a gap between how execution is measured and how it actually affects outcomes.
Improving execution requires shifting from proof of resolution to visibility of duration, timing, and recovery. Only then can teams prioritize issues based on their real impact and align execution quality with commercial performance.
Frequently asked questions
- Why do before-after photos continue to be widely used despite their limitations?
Before-after photos provide a clear and scalable way to confirm that execution tasks were completed. They create accountability and simplify reporting across large store networks. However, they are designed for validation, not for understanding execution behavior over time. As a result, they remain useful for proof, but insufficient for evaluating impact.
- How does the absence of timing data affect execution decisions at a leadership level?
Without visibility into when issues occur and how long they persist, leaders cannot distinguish between fast recovery and delayed correction. This leads to similar prioritization of issues that have very different levels of customer exposure. Over time, this affects where attention is directed and which execution gaps remain unresolved.
- What is the difference between measuring compliance and measuring execution quality?
Compliance indicates whether a task was eventually completed. Execution quality reflects how that task was performed in relation to customer experience, including how long issues persisted and whether they overlapped with high-impact periods. Two stores can be equally compliant but differ significantly in execution quality.
- How can retailers identify whether delayed issue resolution is affecting store performance?
This requires linking execution timelines with store activity. By tracking when issues appear, how long they remain, and whether they coincide with peak traffic or campaign periods, retailers can assess whether delays are likely to have influenced customer behavior and conversion outcomes.
- What types of execution patterns become visible with continuous monitoring?
Continuous visibility makes it possible to distinguish between short but frequent issues, long-duration breakdowns, and recurring deviations. Each pattern indicates a different underlying cause, such as process gaps, staffing constraints, or escalation delays, and requires a different operational response.
- What changes operationally when execution is evaluated based on timing and duration?
When timing becomes part of execution measurement, teams begin to prioritize speed of recovery alongside task completion. Issues that persist during high-impact periods receive more attention, and recurring problems are addressed more systematically. This shifts execution from a checklist-based process to a time-sensitive operational discipline.